WCP 2026 / STOCKHOLM / #3134

From reported cases
to informed planning.

Can weekly surveillance data help us look ahead? Explore forecasts of depression, Alzheimer’s and Parkinson’s notifications in Mexico—and why local evaluation matters.

26th World Congress of Psychiatry, Stockholm, 23-26 September 2026World Psychiatric Association

E-Poster 3134 · AS17 Digital Psychiatry

Guided by compassion, grounded in science: psychiatry for our time.wcp-congress.com ↗

26th World Congress of Psychiatry · 23–26 September 2026
AS17 Digital Psychiatry · Research, not a clinical decision tool.

PUBLIC SURVEILLANCE DATA · STATISTICS + MACHINE LEARNINGMexico, viewed week by week.

01 / THE POSTER

The complete study. Your pace.

Read, zoom in, or take a copy with you. Both PDFs contain the same study in their respective languages.

English poster · E-Poster 3134 · 16:9 · PDF
Open PDF ↗
English WCP 2026 poster 3134, complete study

Poster edition: 8 September 2026. Frozen conference results, not the latest weekly report. PDF downloads remain available without JavaScript.

Registered title & PDF fingerprints

Population-level prediction of depression, Alzheimer’s disease, and Parkinson’s disease incidence using artificial intelligence: implications for health service planning

The registered title is preserved. The measured outcome is newly reported cases—not clinical incidence, measured care demand or individual risk.

EN · SHA-256
ec5ebd80e3c3f5293a69b1e97ece8b14ab9f0159628ca403cd609666f6e06b7a
ES · SHA-256
8a0a901896f2bb2ba8f7e192a0c876c83391df3133659335a54500d046865760

02 / EXPLORE THE EVIDENCE

What did the forecasts get right?

Compare weekly notifications with model estimates. Switch conditions and evaluation windows to see where performance changes.

Loading the frozen study data…

Evaluation window

National history & forecast

DeepAR
Reported casesModel fit / forecastModel interval

Before the last compared observation: retrospective model fit. Shaded future: forecasts, not observed outcomes. Model interval coverage has not been evaluated. Dates follow the poster’s bulletin calendar.

Read the weekly values as a table
Values behind the interactive chart
All national results & how to read the metrics
National results · both sexes combined · 2026
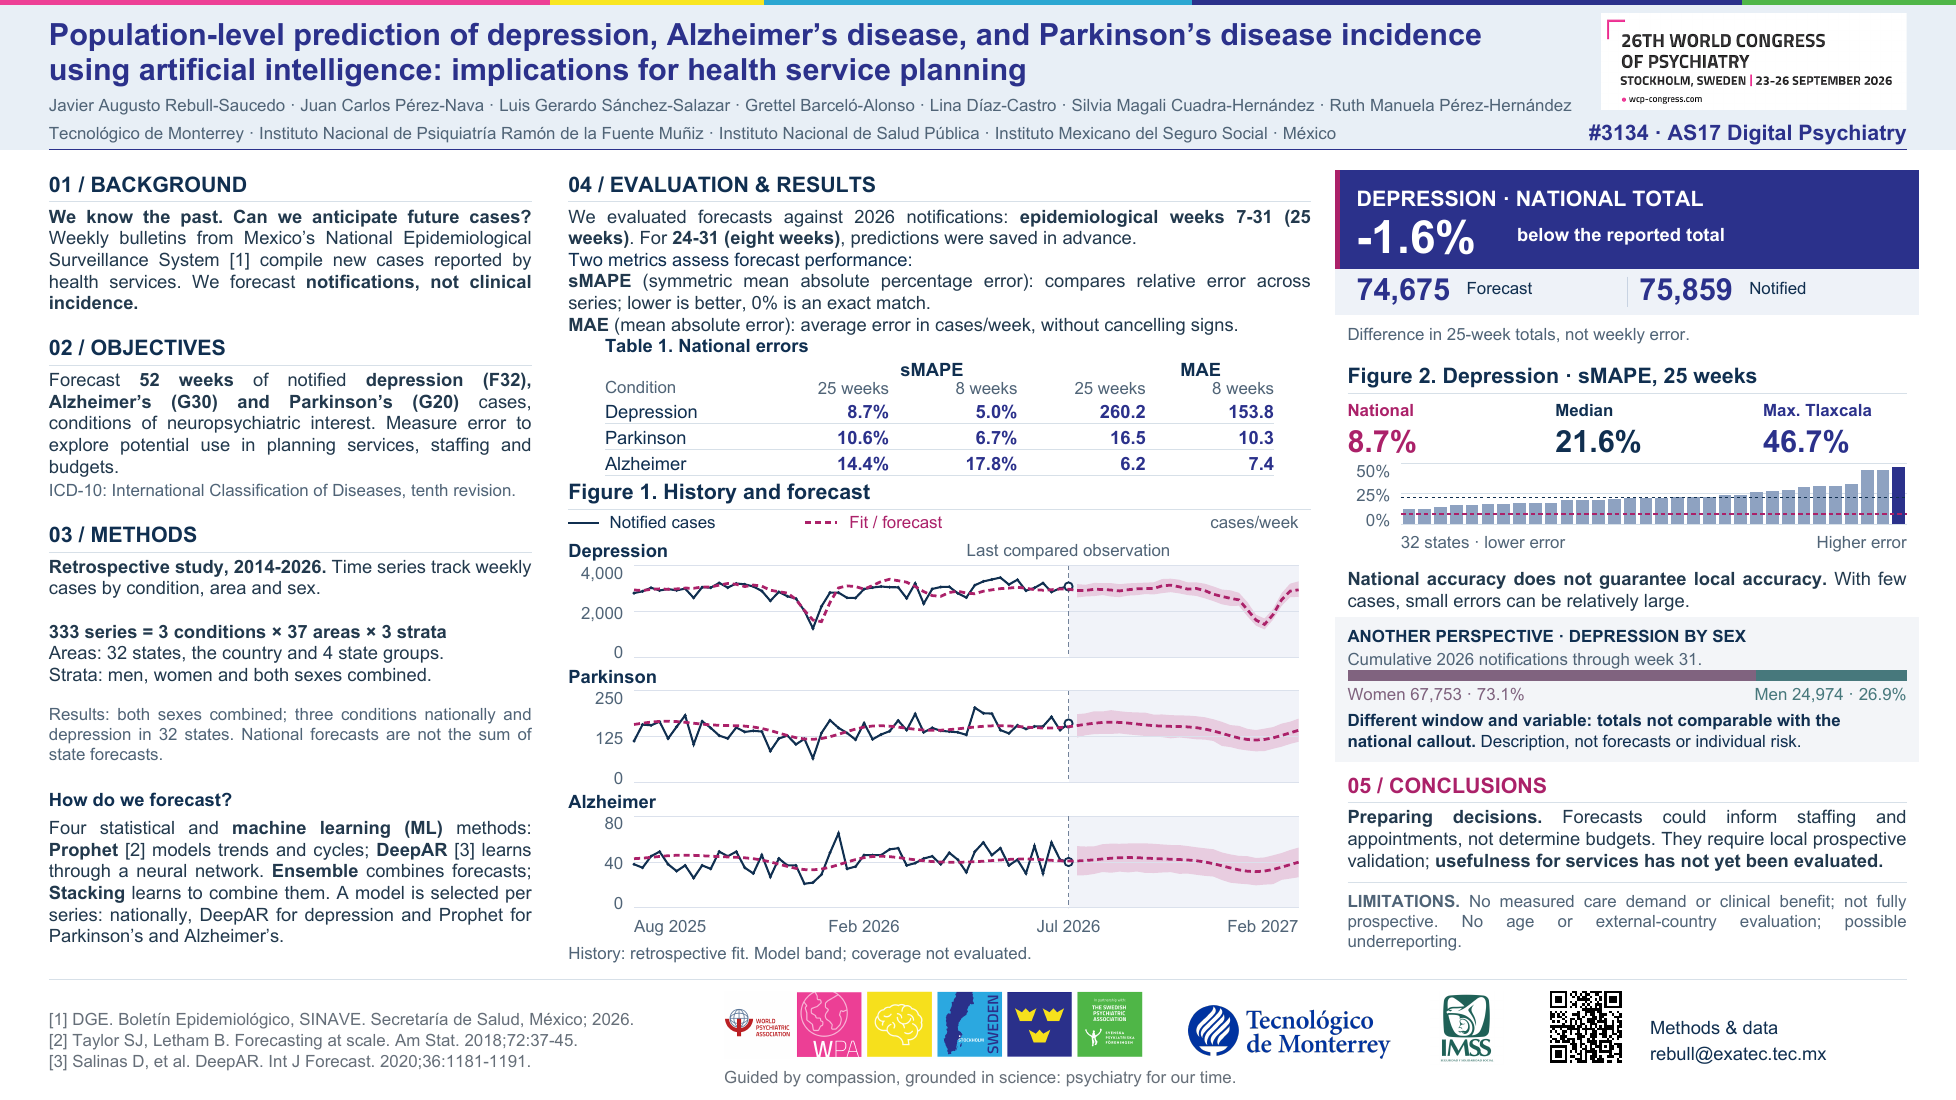
ConditionsMAPE · 25sMAPE · 8MAE · 25MAE · 8
Depression8.7%5.0%260.2153.8
Parkinson’s10.6%6.7%16.510.3
Alzheimer’s14.4%17.8%6.27.4

sMAPE — symmetric mean absolute percentage error. Weekly relative error, averaged across evaluated weeks. Lower is better; 0% is an exact match. It is not “percent accuracy”.

MAE — mean absolute error. The average weekly difference in cases, ignoring its sign. It makes the size of the error concrete. Lower is better.

03 / LOOK BEYOND THE TOTAL

A national result is not a local guarantee.

Depression, epidemiological weeks 7–31. Explore 32 states; the national model is independent, not the sum of the state forecasts.

Where does each state stand?

sMAPE · %
Lower errorHigher error

Descriptive comparison of selected models, not uniform prospective out-of-sample validation. With few reported cases, small absolute errors can become large relative differences. This is a possible mechanism, not a demonstrated explanation for any particular state.

All 32 states: values & selected models

A DIFFERENT LENS / SEX

Who appears in the notifications?

Depression · cumulative 2026 notifications through epidemiological week 31.

Different window and variable. These totals are not directly comparable with the national forecast callout.

92,727reported cases in these sex-specific columns
Women67,75373.1%
Men24,97426.9%

Reported cases—not forecasts, individual risk or predictive performance by sex. This cumulative window differs from the 25-week evaluation. Even when the weeks are aligned, sex-specific cumulative increments do not reconcile with the weekly-case column; the cause has not been established.

04 / HOW THE STUDY WORKS

Four approaches.
One question: what comes next?

A retrospective study of Mexico’s weekly epidemiological notifications, 2014–2026. Each time series follows a condition, territory and sex stratum to reflect patterns a national total may miss.

01

Prophet

A statistical forecasting method that represents trends and recurring cycles.

02

DeepAR

A machine-learning method: a recurrent neural network learns patterns across related time series.

03

Ensemble

Combines predictions from several methods to bring different forecasting perspectives together.

04

Stacking

Uses a learned combination of model predictions rather than relying on a single approach.

A model is selected for each series. National results here use DeepAR for depression and Prophet for Parkinson’s and Alzheimer’s. We do not claim that every historical selection is the universally best model.

Series, evaluation windows & limitations

333 designed series = 3 conditions × 37 areas × 3 strata. Areas: 32 states, the national total and 4 groups of states. Strata: men, women and both sexes combined. Forecasts were retained for 297 series; 36 regional series were not evaluated because geographic names differed between files. Results here cover three national conditions and depression in 32 states, both sexes combined.

The 25-week window (weeks 7–31 of 2026) describes agreement with notifications. For weeks 24–31, evaluated predictions match the file dated 5 June 2026 within the documented rounding tolerance. The file predates those weeks; it does not establish the full training chronology or a cryptographically certified timestamp. The evaluation is not fully prospective.

Notifications are not clinical incidence or measured care demand. Access, reporting and underreporting may affect counts. Age and transfer outside Mexico were not evaluated. Clinical benefit, staffing impact, savings and budget-allocation effects were not measured.

The frozen 52-week forecast runs from 9 February 2026 to 1 February 2027. It is not a new forecast starting when you visit this page. Historical model fits are not presented as past prospective forecasts.

Sex-specific cumulative columns and the weekly general-case column do not reconcile exactly over the evaluation window. Their difference has not been assigned to a cause or artificially reconciled. No forecast is allocated by the proportions in the descriptive sex bar.

05 / FROM EVIDENCE TO NEXT STEPS

Anticipate. Validate locally.
Then evaluate use in services.

Forecasts could help teams ask when and where to prepare staffing and consultations. Local error shows where reliability needs closer examination—not how much money to allocate. Benefits for services still need to be tested.

LET’S TALK AT WCP

Questions worth
a conversation.

Discuss local validation, the forecasting approach, or what a service-planning evaluation should measure.

The research team

Javier Augusto Rebull-Saucedo · Juan Carlos Pérez-Nava · Luis Gerardo Sánchez-Salazar · Grettel Barceló-Alonso · Lina Díaz-Castro · Silvia Magali Cuadra-Hernández · Ruth Manuela Pérez-Hernández

Tecnológico de Monterrey · Instituto Nacional de Psiquiatría Ramón de la Fuente Muñiz · Instituto Nacional de Salud Pública · Instituto Mexicano del Seguro Social · México

No funding was received. Public, aggregated data; no individual identifiers.

Explore the poster

Use the slider to enlarge, then scroll to explore. Escape closes the viewer. Open the PDF for selectable text.

Complete poster, enlarged